Virtual Power and calories support was added with IpBike version 1.3.7. The basic physics provides calculations that give a power number in Watts These values are accumulated and scaled by the Calories Efficiency factor to produce a calories number.
To get good numbers you need to do a little bit of setup. Firstly you need to enter your weight at Settings -> Personal settings -> Rider Weight (kg).
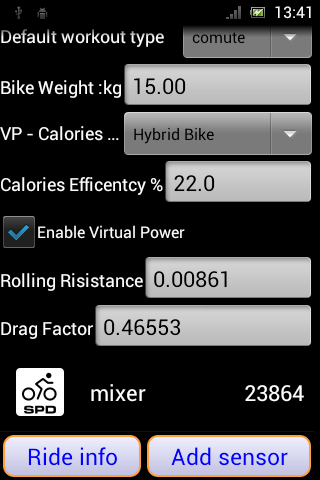
Other settings are per bike from the bike editor. Bike Weight (kg) should be fully loaded bike weight this plus the rider weight effects most of the calculations so you need the total to be something like right. Calories mode distinguishes between running and cycling which leads to slightly different algorithms. The various bike options set default values for rolling resistance and frontal area * drag coefficient numbers. There is also an option here for the Kurt kinetic trainer range. As of version 1.7.5 a Running GOVSS option has been added. The Virtual power enable checkbox means IpBike treat the power numbers as if they had come from a real power meter, e.g. they are displayable and are logged and can be seen on the plot and are uploaded to the various web sites. If you have enabled the virtual power you get two edit boxes where you can modify the Rolling Resistance and the Drag factor (frontal area in Meters squared * drag coefficient) if you want to tweak the numbers a bit. If your are really small you may want to reduce the drag factor if your big you may want to increase it. Calories Efficiency is the body's overall efficiently at generating real Watts from the food you eat this affects the callories number.
For none biking activities e.g. XC Skiing or roller blading etc. I would suggest choosing one of the biking options and then adjusting the drag factor and rolling resistance as you see fit.
If you want to get some custom figures for the drag factor and the rolling resistance this site has a handy online calculator that outputs exactly the numbers IpBike needs.
The basic physics for the power calculation has 4 components.
Rolling Resistance simple based off speed and weight and the Rolling Resistance number. The default Rolling resistance numbers for the different bike choices reflect typical numbers you may get for a given bike. If you think your bike is radically different tweak the number. the mountain bike number is assuming off rode tires and fire-road style surfaces. For a speed and resistance number this number is nice and stable.
Drag is based off speed and the drag factor which is frontal area * drag coefficient. This is the number that gets big quickly as you go fast as the speed term is effectively cubed for a power number. The different bike choices effect the default drag factor setting. For a TT bike I expect the rider position to reduce the frontal area and the drag coefficient to also be better. For a mountain bike I am assuming a fairly upright position so a bigger frontal area and a worse drag coefficient. For a speed and drag number this number is nice and stable.
Acceleration power is related to the difference in speed and the total weight. it can be positive or negative. The quality of this number is very dependent on the quality of the speed number available. ANT sensor based speed is considerably better than GPS only based speed and will always be used when available. GPS only speed can sometimes oscillate up and down which will look like acceleration and deceleration for power purposes. This can lead to bad short term power numbers. When you look at longer averages though the oscillations have less effect.
Elevation change related power is related to the slope speed and weight. It can also be positive or negative. This is the number with the worst level of accuracy. Even with pressure sensor based altitude the basic slope number has quite a bit of variation and a good bit of time lag. Gps based slope has considerably more lag as I try and filter the raw values which can be all over the place. Without a pressure sensor the virtual power numbers are seriously flawed. I use the slope number as detailed on the altitude help page. The filter options outlined there will affect the slope number I use for the virtual power.
These 4 components are put together to get a total power number every second. If you want to see the individual contributing factors you can display each sub bit from the debug displayable items. In Biking mode the numbers are just all added up. If the result is negative I currently clamp it to zero. This may not be the right thing to do but recording negative power is liable to cause trouble with third party software. Also you really don't want to record the expected negative caused by breaking. In running mode I don't strictly add the numbers all up event when slowing down or running down hill you still have to expend power when running. I basically only allow negative components to reduce positive numbers by a maximum of half for running.
Calories efficiency %. This is the number used to convert the total mechanical work as gathered by summing all the virtual power numbers into a calories number. People normally have a range of about 19%-25% the lower the number the more calories the body needs for the given exercise. if you want to tweak the calories number up or down this is the number to tweak.
With 1.3.8 I have added a calibration procedure that will try and work out the rolling resistance and the drag factor. The basic procedure is to find a suitable bit of road then coast from fast to slow. The data while you are coasting is captured and used to calculate the factors. You can then accept these values by themselves or average them in with previous calibrations so you can to multiple roll downs to improve the quality of the calibration. The most important thing is that have a good place and good weather for the calibration. You need a very flat bit of road I use a section by a lake that is clearly very flat. You need to have no wind.
Having found a suitable bit of road and suitable weather. Long press on a power related item like 5s average or 30s average and select the calibrate menu option. Now press start and accelerate onto your stretch of road go as fast as you can then start coasting. The system detect as you stop accelerating and start coasting and starts recording. Stay in the position you typically ride in on the bike and coast to a good slow speed e.g. 5-6 kmh. then press the stop button. You will now be presented with the calculated rolling resistance and drag factors for this calibration and also if you were to combine this calibration with previous calibrations. You can select these 2 options or choose to cancel. The quality - error value says how well the data is fitting the calculated factors, the smaller the better. If your getting more than 50 you really need a better location or less wind... I would always recommend doing a number of calibration runs in different directions and using the combined numbers.
The virtual power number can not be expected to be accurate, if you want real power numbers spend your cash on a real power meter there is no substitute.
The main reasons for inaccuracy are the quality of the sensor data available and the lack of the necessary information. Most critically missing for cycling is the real wind speed which is needed for a good drag related power number. Drafting is not accounted for either it effectively is just an effect on the wind speed. The windyer the weather the worse the numbers will be. For a circular route things should even out a bit but when going point to point the numbers can be very bad for say a 20kph headwind or tail wind...
The quality of the elevation data and the lag introduced by the necessary filtering to get it even with a pressure senor make the data quirky. On a steady slope you get good numbers on a changing slope you get an high value accelerating over the top of a hill and a low number going into the bottom bottom of a hill the averages should still be good. Without a pressure sensor the elevation data is very questionable.
There is a possibility of improving the drag number based off the pressure and potentially the humidity if suitable sensors are available.
I plan to look at the various online weather sources to look at getting wind data to try and add this into the mix.