IpBike
IpBike is a bike computer app primarily designed to be used with ANT+™ sensors on ANT enabled Android smart-phones or with a USB ANT stick on a USB Host mode capable phone. The Sonyericsson range has good ANT support and there is now support the High end Samsung range since the S4 with the Android 4.3 update. If looking for a new phone the obvious candidate and my main test device is the Xperia Z3 Compact which is waterproof and has the added bonus of a pressure sensor which IpBike takes advantage of to improve the altitude measurements over gps only. The use of sensors means you can use it just as easily indoors on the Turbo trainer or rollers. None ANT capable phones will work but the data is Gps based, so no heart rate, cadence or power like you can get from ANT+ sensors. You still get the good Altitude if you have a pressure sensor like the Galaxy Nexus, Galaxy Note, Galaxy Note II, and Note 3 , Galaxy S3, S4, S5 and Xperia Go do.
The emphasis is on having an app that gives you information whilst you are riding as well as logging all the information for post ride analysis. IpBike has a lot of configuration options (100+ the last time I counted but more being added).
IpBike as available at the moment has a 1 million wheel revolution limit. (Or equivalent distance for gps only mode.) This is ample to try it out. You can unlock the limit by getting the IpBikeKey app which will be available for sale.
The following screenshots are from a 480*320 display as found on the old Xperia Active.
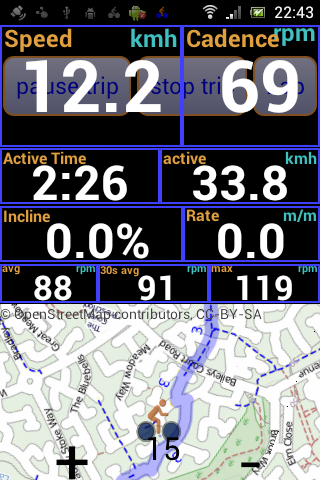
Main screen sensor and trip controls at the top share the space with the main speed readout which is normally on top when active although the buttons underneath are still available and can be brought to the front by touching just above or below them. You can control the sensors start and stop the ride do a manual lap from the top 3 buttons. The lower 4 select which information is used for the main numerical display lines. Selecting between Lap, Trip, Bike and All information.
The bottom buttons allow quick access to the other main screens when not actually riding. The screens are available when riding on pressing the menu button as well.
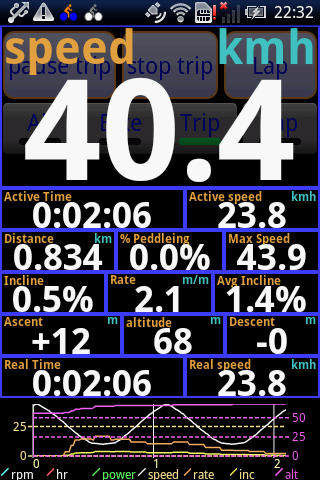
Expanded display while active. No Power, Heart rate or Cadence in this case so what you get with just a speed sensor or GPS only. As configured here we have the following information for the current trip.
- Current Speed
- Active time, Active average speed.
- Distance, Max speed.
- Incline, Climb rate, Ride average incline.
- Ascent, Altitude, Descent.
- Real (total) Time, Real (total) speed.
All this information is available for Total (all bikes added together), Bike (total for this specific bike), trip (this ride) and Lap (manually inserted or automatic lap logging). The units are user selectable, miles, km, knots, Climb rates are available in per second, per minute or per hour format for meters or feet. Incline can be as a % or 1 in format. e.g. 1:10 or 10%. You can optionally have pace instead of speed.
The graph can be configured for what is displayed and whether it is time or distance based and whether the hole trip or just the most recent part is displayed. Just press on it to get the configuration menu or switch to the map or workout displays.
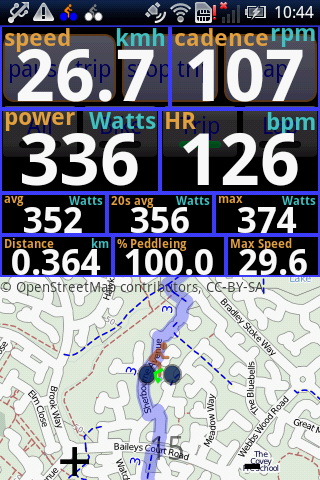
Here we have a setup with ANT+ sensors providing, power, cadence and heart rate as well as speed data. Instead of just speed at the top of the screen we have the current data from each of these senors. The layout adjusts automatically depending what sensors you have. The next line is showing average power, recent average power in this case the last 20 seconds and finally max power. Similar data is available for Heart rate and cadence with the appropriate sensors. In this case the display is cycling though this data in the same space although the 3 lines can be expanded out. The 5 lines seen before are also sharing space and cycling in this case allowing plenty of room for the map view which we have instead of the graph in this case. You can change between map and graph and workout control off the context menus.
The map can either use google mapping data or OpenStreetMap provided data. There are a number of different styles available, including a cycling specific style for the OSM data. I am close to local route 3 highlighted in blue here. The map can be locked to your current location and optionally auto rotated to align itself as you move. With the OSM provided data if you view the area you are interested in before riding it will be automatically cached so it should work without having a data signal. You can also select a .gpx file to load up a route you want to follow, there is even an option to automatically trace it out so as to ensure it is cached. You can also use Mobile Atlas Creator to create local map files so you can have mapping with no data connection. See the map files page for instructions.
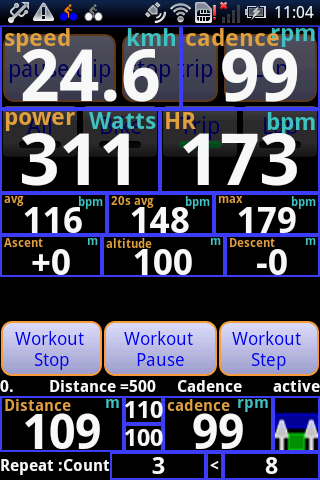
This is the workout control style display, used for doing interval sessions. Here we are on the active part of a workout doing an effort of 500m with 109m still to do. The target for the step is a cadence of 100-110 the current cadence is 99 which is below the target. This is interval 3 of 8 in the workout.
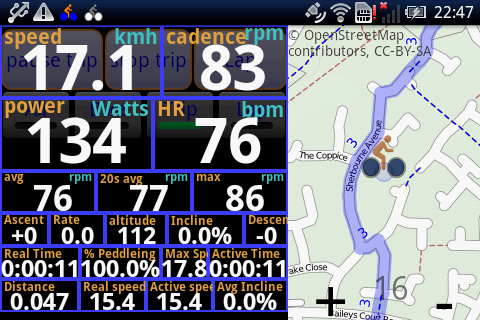
You can have a Landscape orientation if that suits your preferred mounting solution better. Here we have the Data show-en before over 5 lines compressed onto just 3 with slightly smaller fonts. This option makes the best use of the space in landscape mode in this case.

Here is the workout definition page. We have a 10 minute warm up a 500m effort with a heart rate target of 85% to 95% of maximum. The rest step is of a length of 1 minute. These two steps are repeated 8 times. Off screen there is a 10 minute cool down.
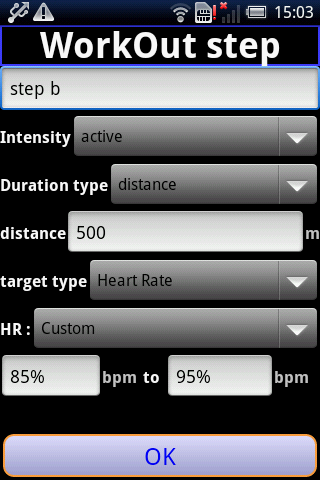
Here is the detailed definition page for the active step of the previous workout.
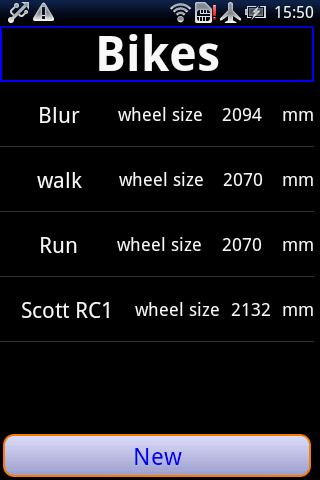
Bikes list page. Lets you setup and distinguish between different bikes. Of course with the gps only mode you can actually log other activities so I also have 'bikes' called run and walk setup.
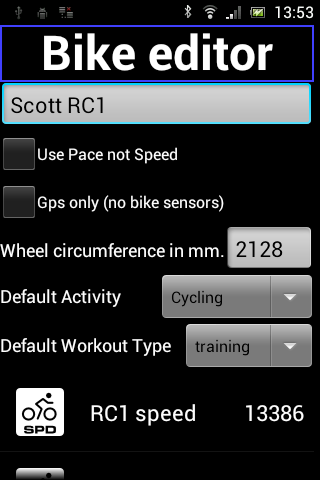
Bike editor lets you name the bike and assign sensor to it that are used to automatically select the right bike when you ride. If you have no sensors or a non ANT capable phone you need to select Gps only and will choose from the bikes list when starting up. If not Gps only the wheel circumference in mm should be set accurately for best results when using sensors. 1mm out will lead to an 8 meter discrepancy over 10 miles. I advice you to get the tape measure out and do it correctly. For each bike you can choose whether to default to speed or pace, so I have pace setup for my 'run' and 'walk' bikes
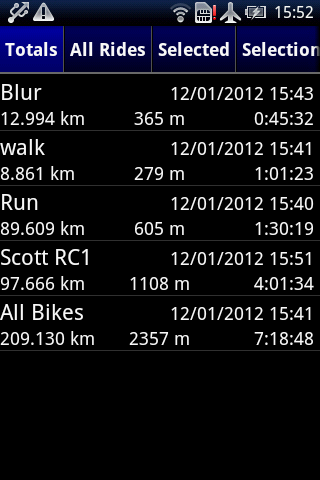
Ride history page, currently on the totals tab where you can see the all time and per bike totals.
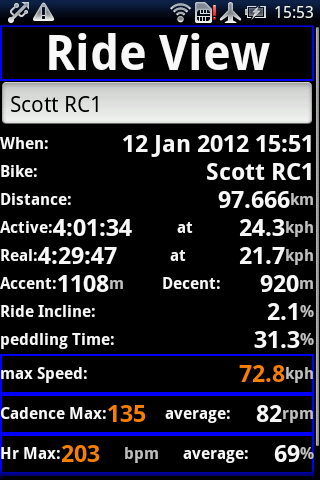
This is the all bikes totals page. The maximum values can be reset by long pressing the coloured lines and selecting the option from the menu.
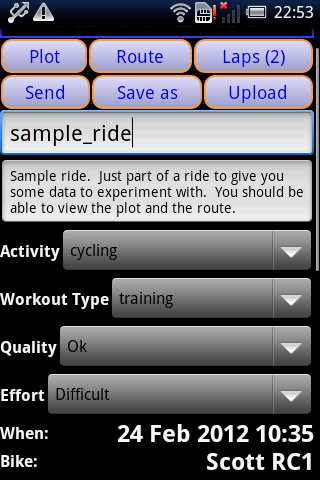
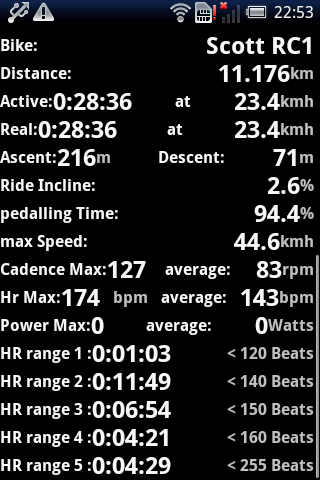
This is the ride information page, with everything you could want to know about the ride available. The heart rate and power range information at the end is configurable for your own particular training zones. The classification options are used when uploading to various web sites. You can configure your own terms but making them match your target website the the best idea.
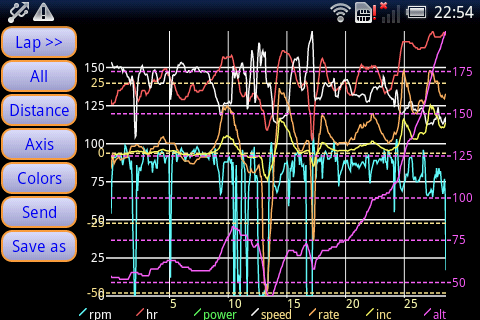
This is the plot for the sample ride shipped with IpBike. You can pan and zoom the plot and save out the image at higher resolution if you want to. You can send the big image to other apps I use this feature to upload the images to Picasa or Facebook.
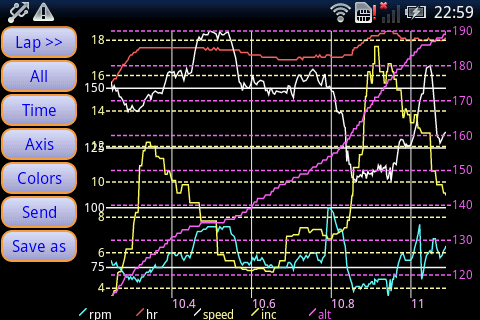
This is the same plot but zoomed into the climbing section at the end. My heart rate quickly goes above 150 bpm and gets up to about 170 on the upper steep section which has a max gradient of 17% where I just about manage to keep the speed over 10 kmh.

This is a list of the laps recorded for a particular ride.
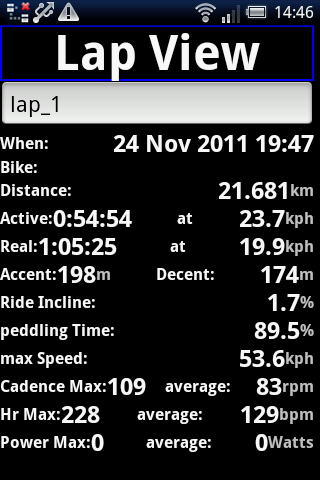
And the information available for an individual lap.
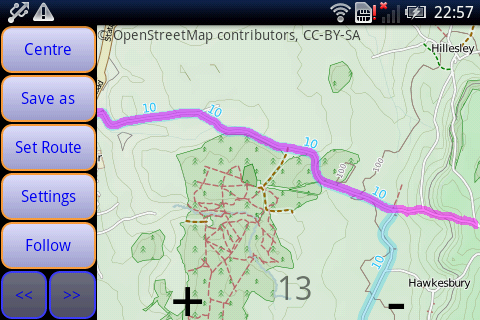
Part of the route for a ride viewed post ride. The map data is from OSM in this case a cycling specific tile source. You can load a .gpx, .kml or .fit file with a route you want to follow, highlighted in magenta here. With the OSM data source you can 'follow' the route before setting out in order to get the map preloaded before you ride so you want need a data signal when out.
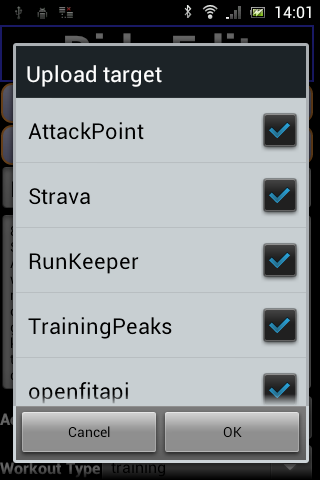
This is the upload selections dialog. As you can see there are a good number of online training log websites directly supports. Currently the list includes. AttackPoint, RunKeeper, TrainigPeaks, SportTracks.mobi , StriveMax, Trainingstagebuch.org, Strava, Cycling Analytics, RunningAHEAD , VeloHero, What's Today's Plan and OpenFitApi based sites. Some of these other sites have the ability to upload via email these include , RideWithGps and MapMyTracks. IpBike has an automated send feature to help with this task.
If you use another site with a public API with suitable license conditions then please let me know and I will look at adding support.


